Introduction:
Investing is a complex game of balancing risk and reward. In this entropy, many find that displaying investments using financial models gives assurance and provides a solid argument for why they should invest. This article will cover various financial models like the Discounted Cash Flow model, Three Statement model, and Comparable Company Analysis to give investors a look into the basics of financial modeling.
Discounted Cash Flow Model (DCF)
The discounted cash flow model is one such model that aims to show investors if an investment is worthwhile. Through forecasting and formulas investors can break down companies figuring out the enterprise value and intrinsic value of a stock.
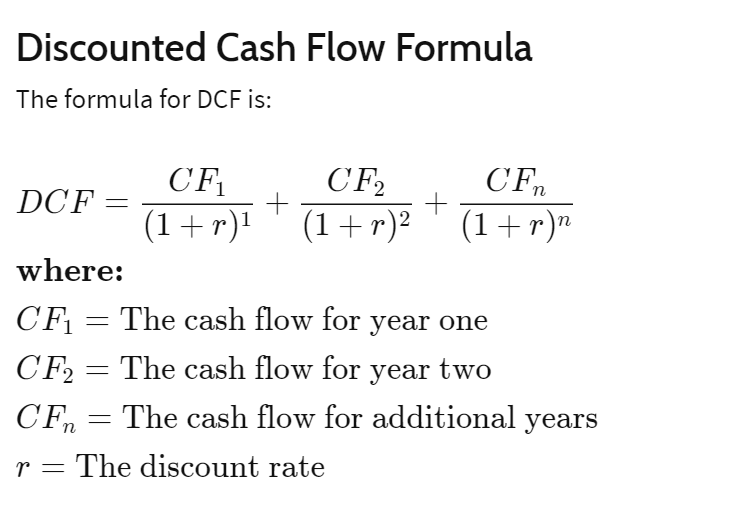
The Discounted Cash Flow model is comprised of two main elements. The first element is cash flow which is the amount of cash moving into and out of a company. Cash flow gives the model an understanding of how much money a company is generating showing its profitability. However, cash flow is not just needed in its present form but also in its future form. What I mean by this is that investors need to forecast cash flow to accurately determine the future value of the company. Because investments are the value of its future cash flows, this number is very effective and essential in this model. However, coming up with this figure is not easy and is where many investors fall short when using the DCF. When forecasting cash flow, it is important to consider historical data analyzing trends in prices, economics, analyst opinions, and cash amortization and depreciation. Remember that making conservative estimates with a margin of safety will highly increase the chances of success using the DCF model.
The 2nd main element of the DCF model is the discount rate. A discount rate is simply a way to discount the cash flow in the future to make it equivalent to its present value. The discount rate used in the DCF model is called the WACC or the weighted average cost of capital. This means the amount of money that it costs to generate money. WACC is commonly used to determine if a company can finance upcoming projects. A lower WACC typically means that the cost of financing a project is less while a higher WACC means the opposite. WACC can be calculated by using the following formula:
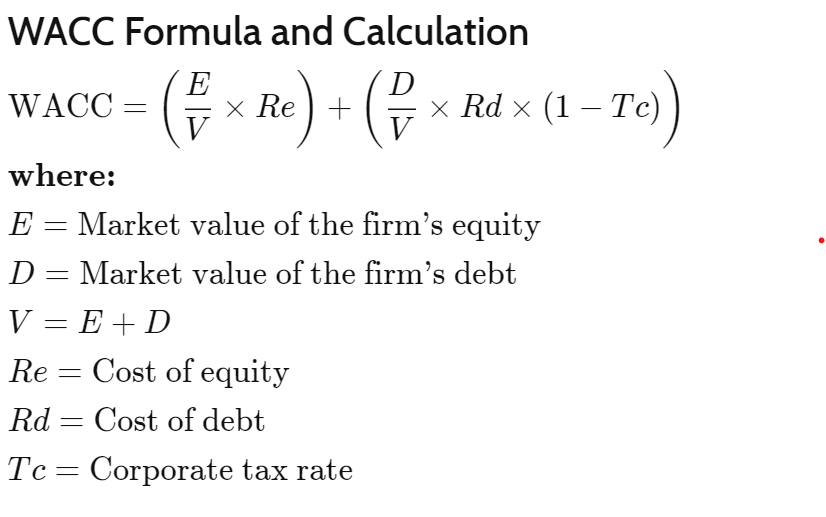
Combining WACC and Cash flow estimates allows investors to understand the present value of a company because it takes the money a company makes and appropriately discounts it. The following formula puts these two elements to finally come to the enterprise value or a company’s total value.
With the Enterprise Value, you can divide that by the number of outstanding shares giving the intrinsic value of a stock.
The intrinsic value of a company can tell you two things. If the DCF value is above the value of the company or stock then that means the stock is undervalued. If the DCF is lower then it is overvalued. Another way to frame this is by putting it in the context of ROI or return on investments. If you find that the intrinsic value is over the present value then the investment has a positive ROI and is likely to grow to that intrinsic value. If the intrinsic value is lower than the present value then the investment has a negative ROI and will likely depreciate.
Three Statement Model
When analyzing a company quantitatively there are three main sources of information: the income statement, the balance sheet, and the cash flow statement. These statements are a huge part of the decision-making process so investors have developed a way to forecast them utilizing historical data and assumptions. This model does not go into depth in analysis but mostly serves as a basis for other financial models.
The Three Statement Model takes in past data from around 5 years from all 3 statements. Utilizing a spreadsheet, investors can set up formulas so that when putting in different assumptions the forecast will change automatically. For example, an investor will forecast revenue growth for the coming years and then multiply its revenue to see how a company’s revenue may grow. To supplement the model some investors include supporting schedules. This is just extra information about debt, deprecation, interest, or whatever the investor wants. This data can also be forecasted giving investors a more holistic view of an investment. This is how a three statement model may be set up to give you a better idea of what I am talking about.
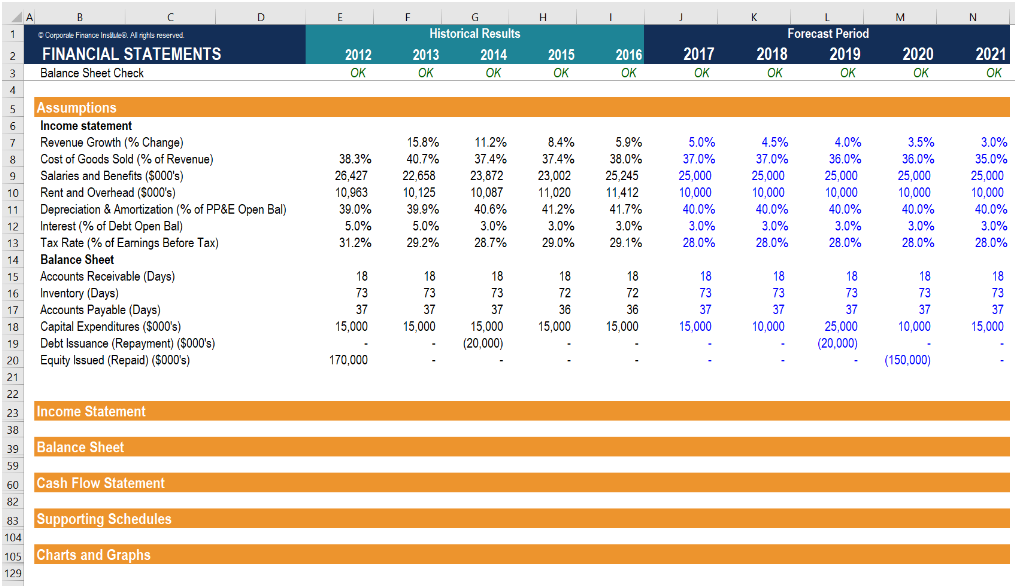
This model is especially useful in long-term investing as it takes into account lots of past data and is used to identify trends, evaluate ratios, and provide information for other models. For example, using this model you would forecast cash flow for upcoming years which could be used in the discounted cash flow model to calculate the intrinsic value of a company. This model is more of a baseline to conduct in-depth financial analysis. Furthermore, this model sometimes includes graphs and charts to easily express a company’s data visually.
Comparable Company Analysis (CAA)
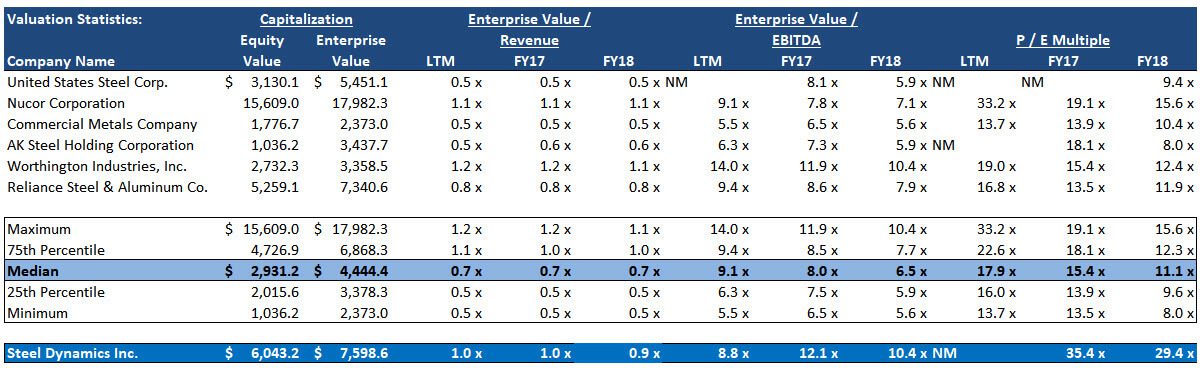
Another way to financially model a company is through the Comparable Company Analysis model. This method establishes a group of competitors and compares the company's metrics to the group. This evaluation technique is based on the key idea that in an industry or sector, there may be some companies that are overvalued or some that are undervalued but if you factor in all of the companies then you should get a fair value. With CAA investors can help determine an industry benchmark and see if the company is undervalued or overvalued based on a metric and relative to its direct competitors.
The first step of CCA is to establish a group of competitors also called Comps. These companies should be linked together in industry, size, and geography. Once you have identified 5-10 Comps, you need to decide a metric to evaluate. However, if you want to go more into depth you can choose a group of metrics. Typically investors choose 1 sales-based and 2 profitability-based metrics. For example, Net Income, P/E ratio, and Net Income growth. This way an investor can see a correlation between metrics to help make a stronger trend. When analyzing this metric it is important to take into account multiple data points from a company over a period of time, looking at historical data and forecasts. Finally, investors can develop an overall price range value to see whether a metric is within the range. This can allow investors to see if a company is over-performing or under-performing compared to its industry. I have provided a brief description of CCA but many investors go deeper calculating enterprise value and equity value.
Conclusion:
The income statement contains a variety of information that can tell you about a company’s growth, profitability, and efficiency. While many ratios or trends are not directly stated in an income statement, the data allows you to calculate more useful metrics. Remember: an investor's key goal should be to predict a company’s growth. Income statements aid in showing a company’s financial health allowing investors to make better investments to grow their money.
Thanks for reading and happy investing!