Introduction:
The income statement is one of the most influential factors in fundamental analysis. An income statement is where a company reports all of its financial data showcasing the health of a company. Companies provide a plethora of information that can often be confusing, but understanding the basics is essential to making informed investments. There are four steps to interpreting the income statement: vocabulary and calculations, key trends, ratios, and red flags.
Vocab and Calculations:
The first step to comprehending this complex document is learning the vocabulary. The first term you will see is revenue, also known as the “top line”. Revenue is simply the amount of money a company makes. This figure does not take into account any costs or deductibles. Next is the cost of goods sold (COGS). This is what it sounds like: the cost of producing the revenue. The difference between these figures is the gross profit which is calculated by subtracting COGS from revenue. For example, let's say you own a lemonade stand. After a week, your stand made 50 dollars. It cost you 10 dollars to make all the lemonade. This means your revenue would be 50, your COGS would be 10, and your gross profit would be 40. However, most businesses are not as simple as this lemonade stand.
Companies also have operating expenses. This can include the cost of rent, utilities, and anything that keeps a business running everyday. Once operating expenses are subtracted from the gross profit, you are left with the operating income.
Finally, the remaining expenses, such as tax and interest, are subtracted from the operating income to find the net profit or the “bottom line”. The net profit is the overall amount of money a company is making (Operating income - tax = net profit). Notice that there is both net and gross profit. Gross profit is the amount earned before taxes and deductibles while net profit is a pure value where all deductions are made. Personally, I remember net profit as a net that catches all the expenses. Net profit is especially important because it is the money that a company has to invest and expand. These terms and calculations should help you understand exactly where a company's money is going.
Key Trends:
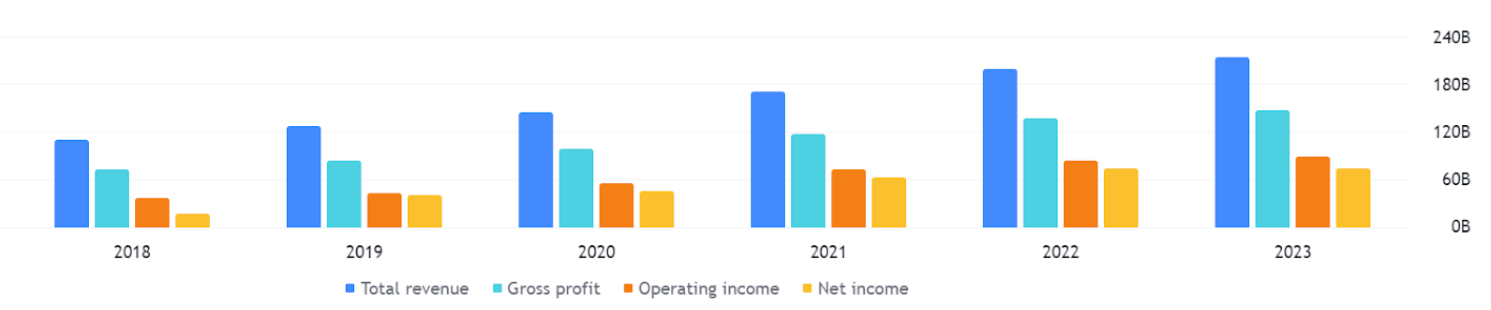
Income statements hold large amounts of information which can be broken down and analyzed to better understand that company. One of the easiest trends to spot in an income statement is a company's overall growth. Generally, income statements will not only have information for that time period, but also for previous time periods. This allows you to look at how the company is growing. A key element for a healthy company is consistent long-term growth. Comparing a company to one of its competitors also helps to justify any outlying data in the consistent growth of revenue. If all companies in a sector had a decline in revenue during one quarter, then it is likely not relevant. Looking into dips in the growth of a company can lead into the discovery of other underlying issues in the company.
Another significant metric is gross profit margin. Gross profit margin shows the amount of money a company keeps from the money it makes. So if a company's gross profit margin was 20% and it made 100$ then the company would retain 20$. This shows a company's profitability or ability to make money. Companies with a higher margin have more flexibility, control, and efficiency, while companies with lower margins tend to struggle to grow. Margin can be calculated by subtracting COGS from revenue then dividing by revenue. Again, comparing this metric against other similar companies can show which company has an advantage over the other.
Ratios:
The most important ratios on the income statement are the P/E and the EPS. I won’t be explaining these ratios because they are very commonly discussed; however, I highly recommend researching the P/E and EPS ratios if you are not already familiar.
The income statement showcases a variety of ratios including the quick ratio. The quick ratio shows a company’s liquidity or ability to convert its assets into cash and pay off its short term liabilities. Highly liquid companies have the ability to adapt to adverse economic conditions, while non-liquid companies will struggle greatly; therefore, liquid companies tend to be safer. If a company has a quick ratio of 1.50, then for every 1$ of liabilities the company has, 1.50$ of assets that can be converted into cash. So if a company’s quick ratio is 1, then it can pay back all of its liabilities with all of its assets. You want a company that can handle any debt or liabilities it incurs, so a quick ratio of 1 or greater is preferred.
Another prominent ratio is return on equity (ROE). ROE, similar to margin, shows a company's profitability but in relation to equity. Equity is the true value of something. Therefore, ROE measures profitability compared to a company's true value. This helps determine if a company is efficiently using its money to grow. A good rule of thumb for an investor is 15% to 20% ROE, meaning that the company is efficiently using its money and is set to grow at a moderate rate. ROE can be calculated by dividing the company’s net income by its shareholders’ equity.
Red Flags:
Income statements may also reveal red flags in the company's financials which can indicate that a company may not be a good choice to invest in. One of these red flags is a declining gross margin. A declining gross margin means that a company’s cost of goods sold (COGS) is increasing faster than its revenue. This is a blaring red flag because it shows that profitability is declining rather than increasing. This means that the company is getting less efficient and does not have control over its production.
Another red flag is rising operating expenses. This means that the costs of running a company is increasing. While some increase in operating expenses is normal with business growth, a significant and sustained rise may mean the company is losing efficiency, or being mismanaged. Cost control is very important for a company because too much cost can lead to lower margins, therefore lowering net income and reducing profitability.
The final red flag is high levels of debt and interest expenses. One way to assess if a company's debt is too high is to compare it to its assets which can be found on the balance sheet. High levels of debt and interest expenses means that a company is relying heavily on borrowed funds. Using borrowed funds adds risk and instability. This could mean that the company is struggling or will struggle if there is an economic downturn. More debt means more risk to investors.
Conclusion:
The income statement contains a variety of information that can tell you about a company’s growth, profitability, and efficiency. While many ratios or trends are not directly stated in an income statement, the data allows you to calculate more useful metrics. Remember: an investor's key goal should be to predict a company’s growth. Income statements aid in showing a company’s financial health allowing investors to make better investments to grow their money.
Thanks for reading and happy investing!